Drawdown Depth vs Duration
A live case study in measuring drawdown on two axes: depth and duration. My current drawdown is at the 16th percentile for depth and the 3rd for duration.
- Measure every drawdown in your history on two axes, depth and time, and build a distribution for each. Then percentile the live one against its own history.
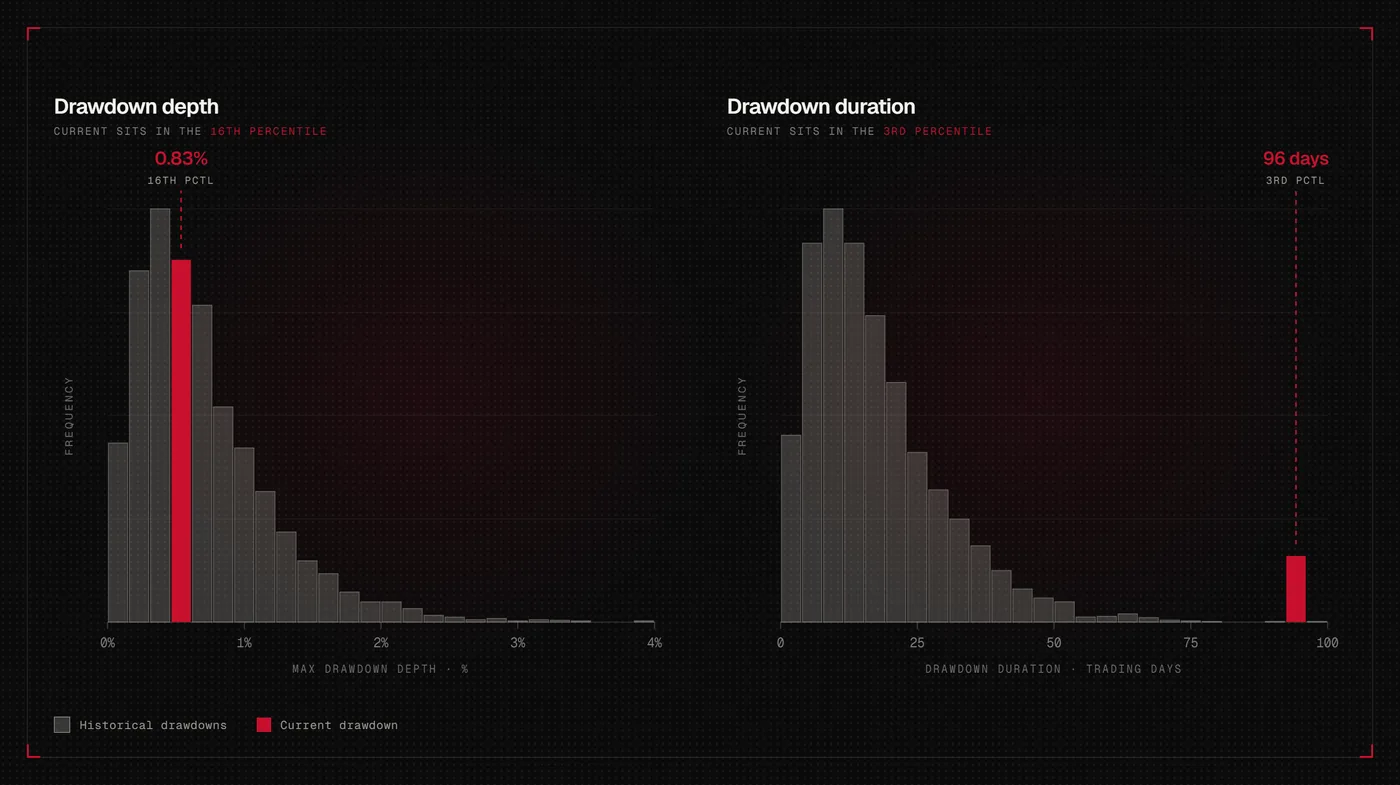
- My current drawdown: -0.83% deep, which is the 16th percentile of the book’s history (normal). 96 trading days long, which is the 3rd percentile (investigate).
- A drawdown can be statistically fine on one axis and an outlier on the other. Each axis points at a different problem. Measure both.
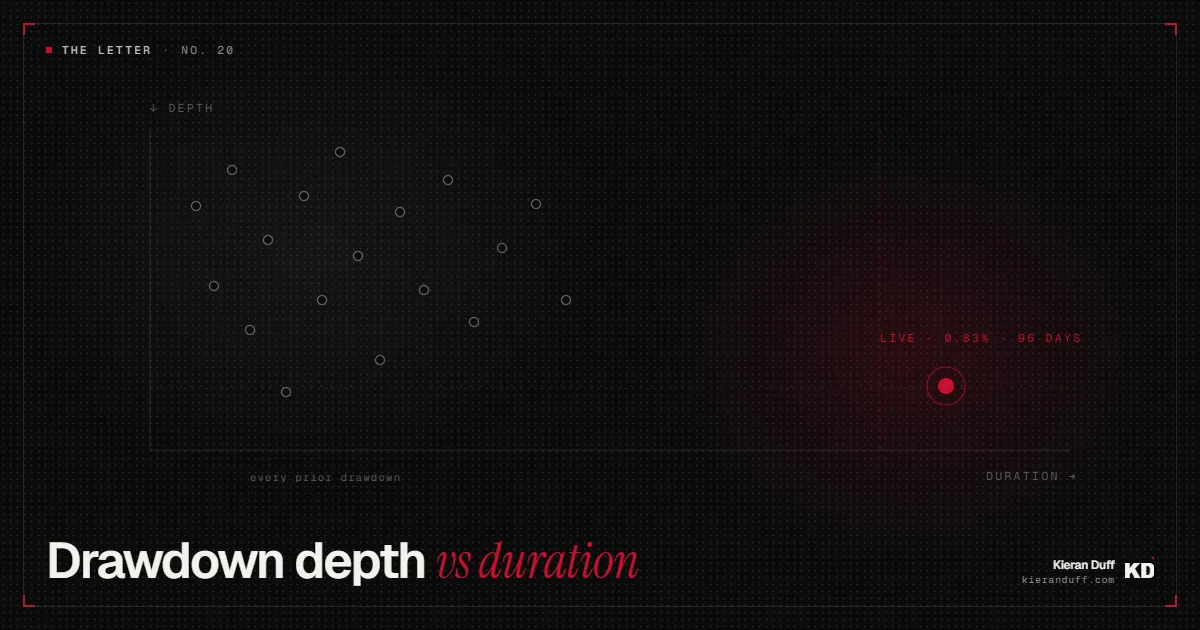
A drawdown has two dimensions: how deep it goes (depth) and how long it lasts (duration). Depth is the number on the risk page, the one everyone worries about. Duration is the one you actually live and breathe. Right now my own book is running an object lesson in the difference, because the depth of my current drawdown is completely normal for this portfolio whilst the length of it sits at the 3rd percentile of everything it has ever done (since being live, not including backtested data).
Why measure drawdowns on depth and time?
Because max drawdown, the statistic everyone leads with, is one number describing one event. It tells you the single worst thing that has ever happened to the equity curve. Useful, but it says almost nothing about what your book is like.
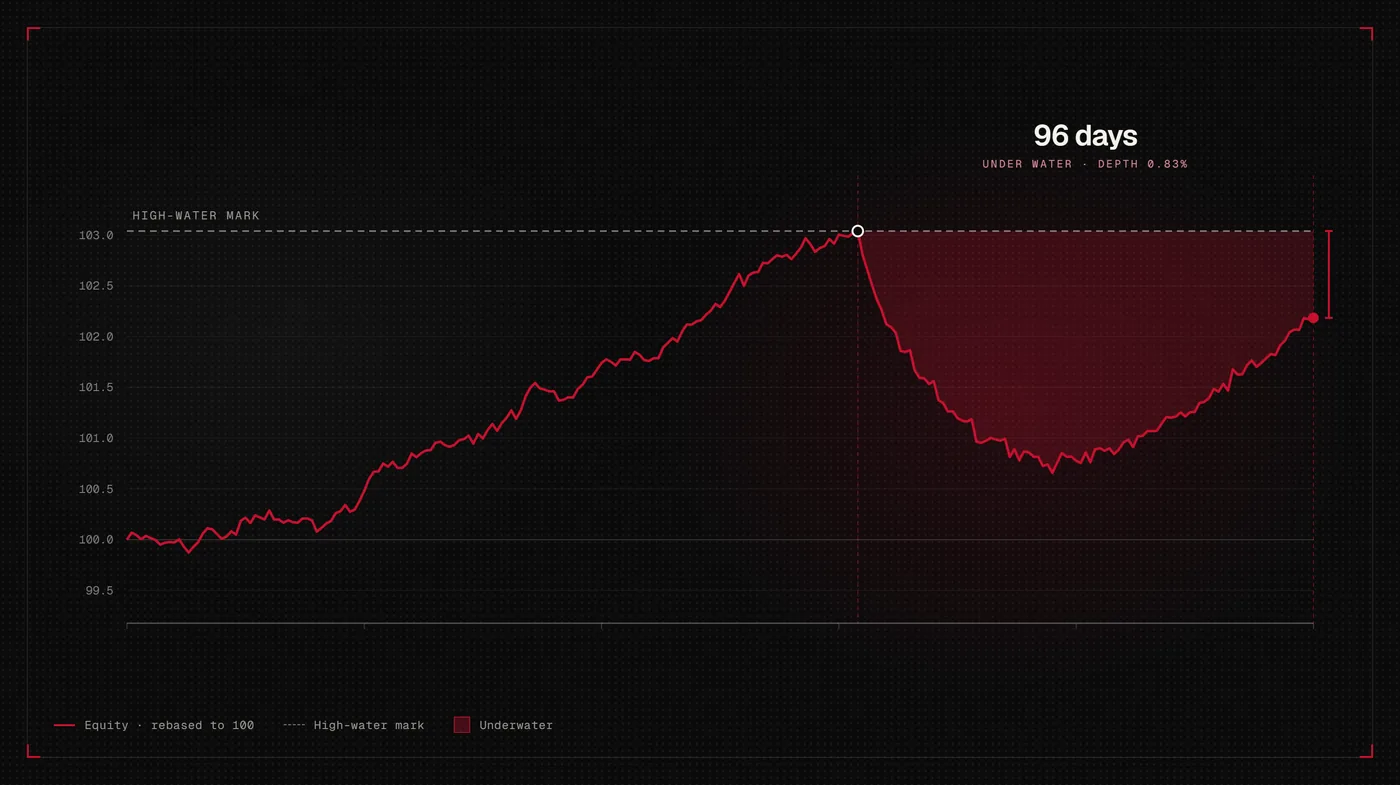
Every drawdown your account has ever had is a data point with a shape: it went this deep, it took this long to resolve. Collect all of them and you have two distributions, one for depth and one for duration, and that pair is the closest thing you will ever get to the actual behaviour of your portfolio under stress. Once you have it, the question in a live drawdown stops being “how do I feel about this” and becomes something answerable: where does this one sit against everything the book has done before?
I call this depth x time. Max drawdown tells you the worst day of the book’s life. The distributions tell you its personality.
Max drawdown tells you the worst day of the book’s life. The distributions tell you its personality.
Where the book stands right now
As of 26 August, my master account sits -0.83% below its high-water mark. The peak was 14 April 2026. On the public Darwinex page, where XAQP is risk-managed to a higher volatility target, the same hole reads as -3.61% below the all-time-high quote of 150.21. Same drawdown, two rulers: the master account runs at 2.70% annualised volatility, the DARWIN wrapper at 9.93%, so every move is scaled up accordingly.
The duration is where it gets interesting. My quant desk counts 96 trading days under water. Darwinex counts calendar days and says 134. Both are measuring the same wait since mid-April, and it is comfortably the longest stretch below a high-water mark this portfolio has produced since going live. Depth has never been the book’s problem. Sitting still is the new experience.
Since inception the DARWIN is up +44.79% with that -5.83% max drawdown, so nothing about the current gap is threatening the track record.
Is a 96-day drawdown normal?
For this book, no. Against the distribution of every drawdown the account has produced, the current depth of -0.83% sits at the 16th percentile (shallower than most, in fact). The duration sits at the 3rd percentile. Ninety-seven percent of this book’s underwater spells resolved faster than this one has.
Another lens: The trailing 90-day return is -0.27%, which is the 9th percentile of all the 90-day windows the account has produced. In cash terms, a flat quarter on a 2.70% vol book is nothing. Behaviourally it’s unusual, and behaviour is the thing I’m actually monitoring here.
One honesty note before anyone runs this on their own account: be careful how much evidence you think you have. My history is 349 trading days, roughly sixteen months. That holds just five independent 90-day windows. A naive rolling calculation will happily report 258 of them, because overlapping windows recycle the same days and flatter your sample size. Percentiles built on thin history are a prompt to look closer. They are never proof.
The depth says nothing is wrong. The length says go and look.
Why percentiles instead of standard deviations?
Because my daily returns are not normally distributed, and yours almost certainly aren’t either. A Jarque-Bera test on this account rejects normality outright (p value of 0.000). The moment that test fails, “this move is 2.5 sigma” stops meaning what people want it to mean, because the sigma maths assumes a bell curve and the data isn’t one.
Percentiles make no such assumption. They ask a cleaner question: out of everything this specific book has ever done, how unusual is today? No model. No guesswork about the shape of the curve. Just the account’s own record ranked against itself.
One caveat that matters for both approaches: my equity line is a daily close mark. An intraday spike that recovered before the bell does not exist in that data. Know what your ruler actually measures before you trust what it tells you.
What does “investigate” actually mean?
It does not mean panic, and it does not mean “touch the book”. The portfolio is -0.83% off its highs. Nothing is bleeding.
It means the two axes point at different failure modes, and the unusual axis picks the hypothesis. Depth is the risk-event axis: a fat outlier there sends you to sizing, correlation, execution, the things that lose money quickly. Duration is the edge axis: an outlier there asks whether the conditions your strategies were built for have simply not shown up, or whether something has genuinely decayed. My depth is normal and my duration is extreme, so the question isn’t “what lost money?”. Nothing did. The question is “why has nothing made any?”.
So the investigation is behavioural. Are the strategies trading at their historical frequency or are the regime filters deliberately keeping them flat, is the flatness one strategy dragging the whole book or twenty strategies offsetting each other to zero, and have spreads or execution costs drifted on the pairs that usually do the heavy lifting? Each of those has a factual answer. If every answer comes back normal, the right move is the least satisfying one: keep sitting.
I’ve said for a long time that one of the hardest skills in trading is sitting in drawdown with full conviction while also knowing the point at which conviction stops being valid. This framework is that point, written down as a number in advance. Sitting tight is a decision. So is digging. The percentile tells you which one you owe the book.
How bad should you expect a drawdown to get?
This is a different question from “is today normal?”. A percentile ranks the present against the past. It cannot tell you the worst your book should produce over a full run, because your realised history is one path out of the many the same daily returns could have taken.
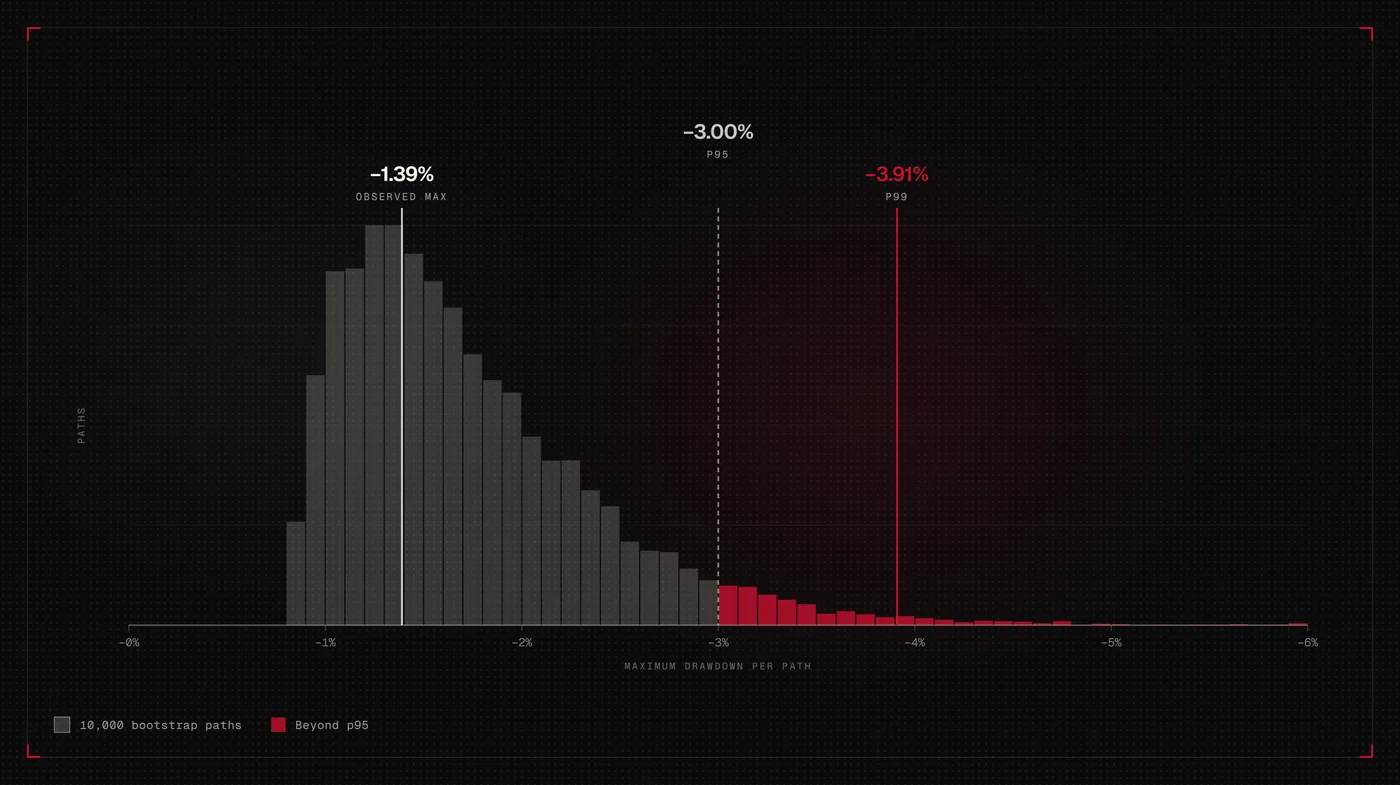
So I bootstrap it: resample the account’s own daily returns into 10,000 alternative histories, record the maximum drawdown each path produces, and read the percentiles off the resulting distribution to see what this book’s arithmetic actually implies about its own worst case. On this book, the 95th percentile of those simulated maximums is a -3.00% drawdown and the 99th is -3.91%, against a worst observed of -1.39% on the master account. The book’s own arithmetic says a drawdown roughly twice as deep as anything I’ve lived through is well within expected behaviour (great).
When the -3% day eventually arrives, it will land with us already knowing it’s possible as the simulation priced it years earlier. The time to meet your p99 drawdown is in a simulation.
The time to meet your p99 drawdown is in a simulation.
Why I built a quant desk for this
Everything above comes off a piece of software I’m building for myself: a quant desk that bridges my trading accounts to a frontend and runs this analysis continuously. Equity reconstruction, the depth and duration distributions, the window percentiles, the bootstrap sims, all of it reconstructed and maintained continuously without me having to touch a spreadsheet, which matters more than it sounds when the alternative is exporting broker statements every day, another task to keep on top of. Each metric resolves to a plain verdict: normal, or investigate. Nothing else.
The point of building this was to change what I look at. I don’t open it to check P&L. I open it to ask one question: is the book inside its own normal behaviour? Most days the answer is yes and I close the tab. This month it flagged duration, which is why you’re reading this article instead of one about weekend gaps or some other systematic trading topic.
Watching P&L makes you react to intraday nonsense. Watching behaviour tells you when a reaction is actually owed.
Common questions
How do you measure drawdown duration?
Count the days your equity closes below its previous high-water mark, and pick one calendar. I use trading days on the master account (96 right now); Darwinex uses calendar days (134). Either works. Mixing them mid-analysis doesn’t.
Is a long shallow drawdown worse than a short deep one?
They’re two separate readings that happen to share a chart. Depth outliers point at risk events: sizing, correlation, execution. Duration outliers point at edge and regime questions. Rank each against its own distribution and let whichever is unusual set the investigation.
How much history do you need before percentiles mean anything?
More than feels intuitive. Count independent windows only: sixteen months of daily data holds five separate 90-day spans. Young percentiles are a reason to look, never a conclusion.
Does a long drawdown mean the edge is gone?
It can’t tell you that on its own. Regime absence and edge decay produce the same flat equity line. Separating them means checking behaviour: trade frequency against history, per-strategy attribution, filter activity, execution costs. Decay shows up in those details long before it shows up as a verdict.
The wait is data
Every drawdown this book ever has will come with the same two coordinates, a depth and a length, and each one lands somewhere on distributions I already hold. That’s the whole goal: not predicting the drawdown, just knowing where it sits.
Right now I’m a percent from the high on one screen and four and a half months from it on the other. The distributions say the gap is fine and the wait is unusual, so the wait gets investigated and the gap gets ignored. If the checks come back clean, I go back to sitting. Uncomfortable, statistically ordinary, and exactly what the book is for.
Personal commentary, not advice. Capital at risk.
Disclosure. I work for Darwinex (FCA-regulated). This is my personal commentary, not advice. Capital at risk. I am an employee of Darwinex; content touching Darwinex products may represent a conflict of interest, disclosed per MAR Article 20.
XAQP figures are point-in-time as of 26 August 2026 and will change. Past performance is not indicative of future results.
Get the next letter in your inbox.
The systematic trading handbook lands in your welcome email, all 24 chapters of it.
Subscribe now