Ablation Testing
Ablation testing shows which parts of a trading strategy actually work. Replace one component at a time, re-run, and read what the equity curve does.
- Ablation testing neutralises one strategy component at a time and measures what the equity curve does in response.
- A component that survives removal with a change smaller than the strategy’s own noise band is a degree of freedom.
- The result worth chasing is the filter that makes the strategy better when you take it out.
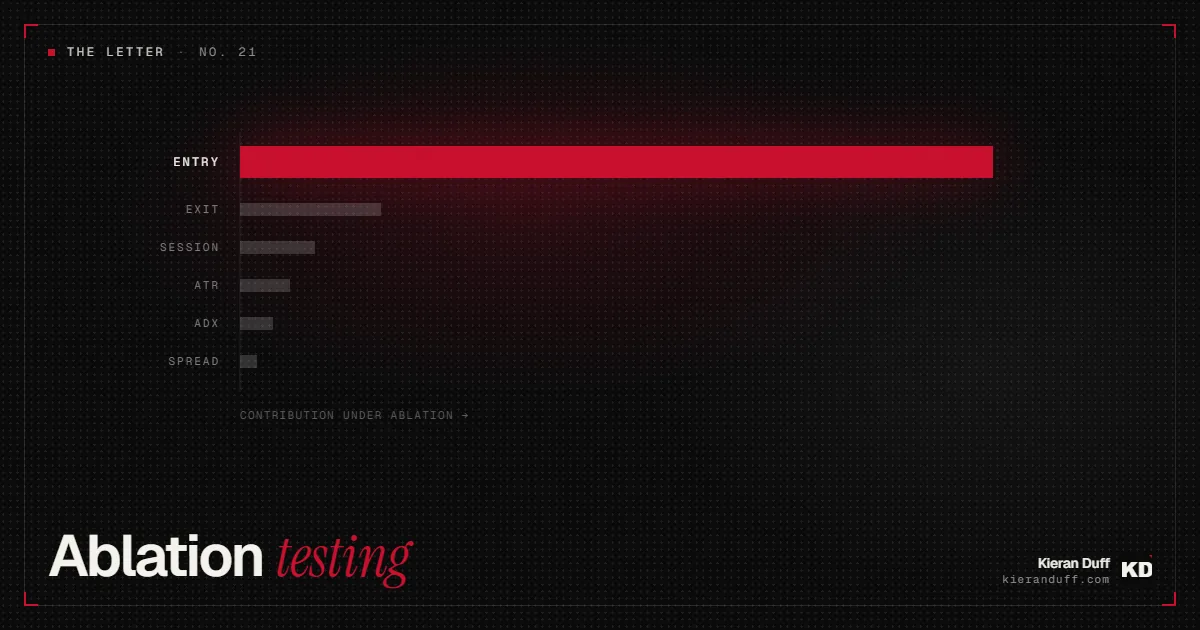
Ablation testing is the quickest way to find out which parts of a systematic strategy are doing real work and which are just there for the ride. You take one component, swap it for something inert, re-run the identical backtest, and read the difference. If the curve barely moves, that component was not really doing much. Every candidate that comes out of my build funnel gets put through this, so that I know exactly what the key functions of each strategy are.
What is ablation testing in a trading strategy?
Ablation testing means removing or neutralising one component of a strategy, re-running the same backtest on the same data with the same costs (costs are crucial), and measuring what changed. The term comes from machine learning, where researchers strip out a layer or a feature to work out how much that piece contributes to the result. Trading-model research uses it the same way: a 2021 reinforcement-learning study ran its model with and without a sentiment indicator specifically to isolate that indicator’s contribution (arXiv).
The trading version is extremely useful. Say you have a gold breakout strategy carrying an ATR volatility filter, an ADX trend filter, a session filter and a spread filter. That’s four filters sitting on top of an entry rule and an exit rule. Six moving parts. Ablation answers the only question that matters about that tidiness: which of the six is the backtest actually resting on?
A parameter sweep measures how sensitive the result is to the value of a knob. Ablation measures whether the knob needs to exist at all. Both belong in a validation suite and they answer completely different questions. Running sweeps without ever running ablations is how you end up with a beautifully stable parameter surface on a component that contributes nothing.
Why do strategy filters accumulate?
Filters accumulate because each one gets added to fix a specific problem visible in the backtest, and nothing ever goes back to check whether the fix is still load-bearing.
The sequence is familiar. There’s an ugly drawdown through a choppy stretch of price, so a volatility filter goes on. A cluster of losses lands around scheduled releases and in goes a news filter. Bad fills around the Sunday open makes you add a session filter. Then the spread assumption starts looking optimistic on the crosses, and by the time you have talked yourself into a spread filter as well the strategy is carrying four gates it did not have a fortnight ago. Each addition is locally rational. Every one of them solved the thing it was brought in to solve.
What you end up holding is four filters, two or three of which are treating overlapping symptoms of the same underlying problem. The strategy trades less and the curve looks smoother. The number of decisions embedded in that curve has doubled. Every one of those decisions was made after seeing the data.
Bailey and López de Prado’s work on the deflated Sharpe ratio is built on exactly this: performance inflates with the number of trials you run, and reporting the winner without accounting for the trials produces over-optimistic expectations (SSRN). Their broader framework on backtest overfitting makes the same point about hold-out testing being unreliable once the search space gets wide (SSRN). A filter added in response to a visible drawdown is a trial.
Ablation is how you find out how many of those trials you can hand back.
How do you run an ablation test?
Pick one component, replace it with something inert, re-run the identical backtest on identical data with identical cost assumptions, and record the delta on the metrics you care about. Then put that component back and move to the next one. One at a time, every time.
The “identical” part is where this goes wrong in practice. If you change the data window, the spread model or the position-sizing rule between runs, you are measuring three things at once and attributing the result to one of them. Lock everything, change one thing.
There are three ways to neutralise a component:
1. Replace it with a constant
The simplest version. An ADX filter that gates entries above 25 becomes a filter that always returns true. A volatility band becomes infinitely wide. The component is still in the code path, still burning the same bars, but it no longer refuses anything.
This is the fastest test and the one to start with. It tells you what the strategy looks like with that gate held open.
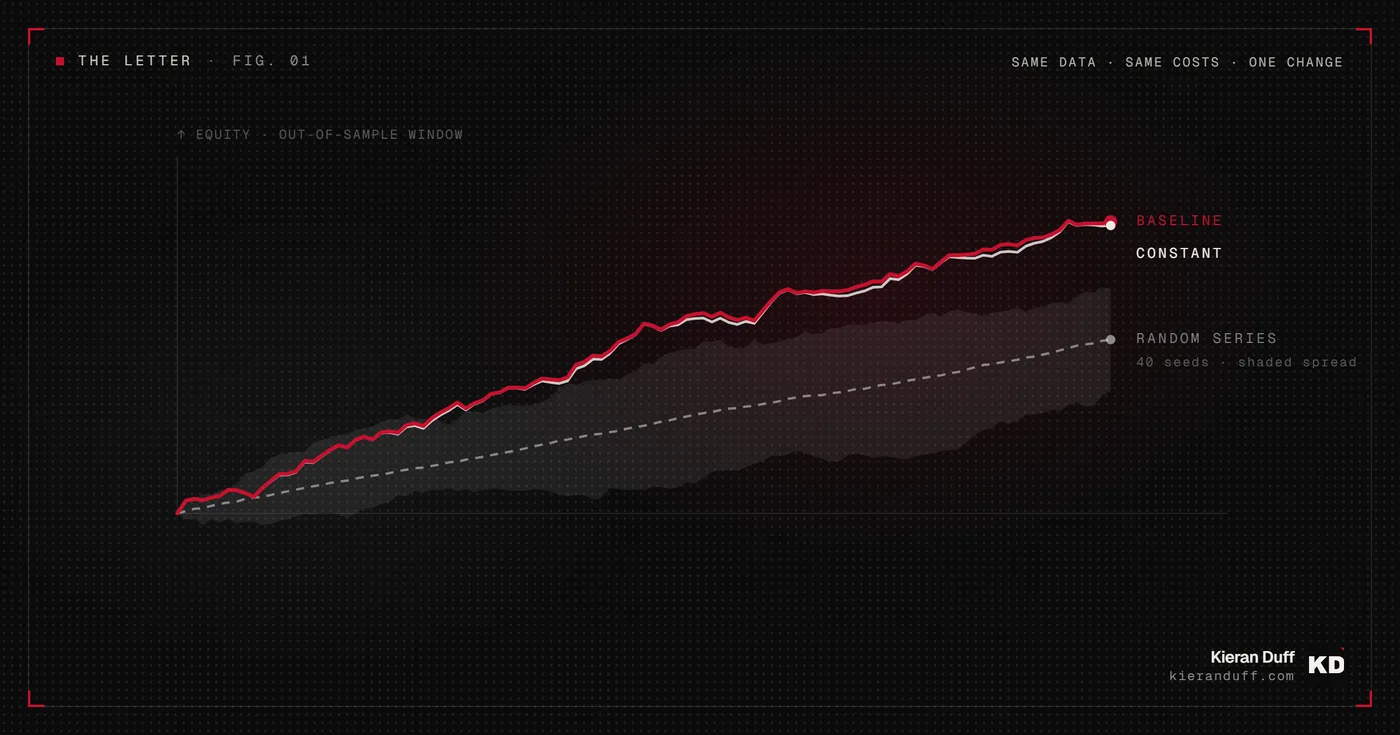
2. Replace it with a random series of the same distribution
The stronger version, and the one that catches things the constant test misses. Instead of holding the gate open, you feed it noise: a random series with the same mean, variance and roughly the same autocorrelation as the real indicator, so the component fires at about the same rate but on meaningless bars.
Why this is sharper: a filter that trades less will often look better on a risk-adjusted basis for reasons that have nothing to do with the filter’s logic. Fewer trades means less cost drag and less exposure. Swapping in a same-distribution random series holds the trade count roughly constant and isolates whether the information in the indicator matters, separate from the fact that it reduced activity. If performance holds up on noise, the component was acting as a throttle and nothing more.
Run this one several times with different random seeds and look at the distribution of outcomes, since a single random draw tells you almost nothing.
3. Remove it entirely
Strip the component from the code and let the strategy run without it. This changes the trade count, so the comparison is messier than the random-series version, but it answers the practical question directly: if I delete this, what do I own?
Worth doing last, as the confirmation step on anything the first two tests flagged.
What size drop counts as real?
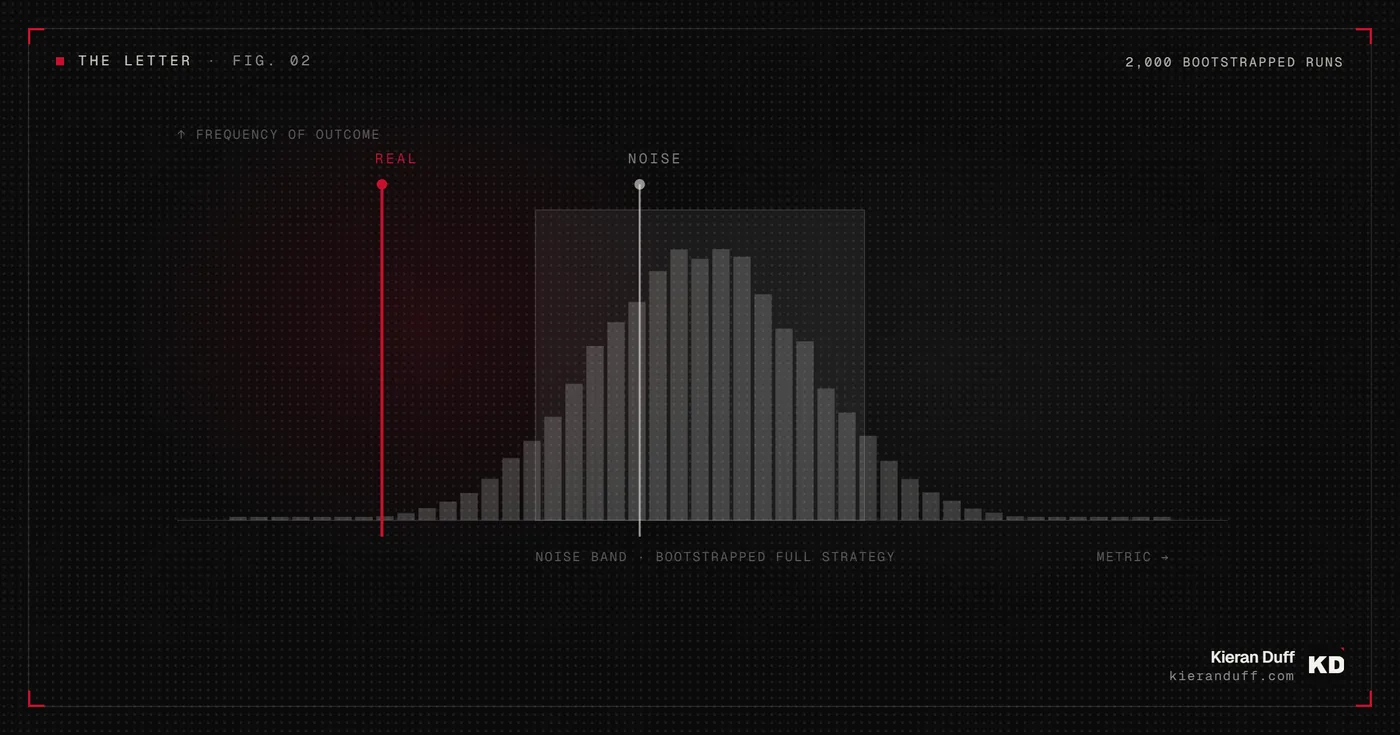
Any change smaller than the strategy’s own run-to-run noise band counts as zero. Establish the noise band first.
Before you ablate anything, bootstrap the full strategy’s trade sequence a few thousand times and record the spread of outcomes on your chosen metric. That spread is your noise band. A component whose removal moves the result inside that band did nothing measurable. A component whose removal pushes the result outside it did something, and now you get to decide whether that something is signal or a fitted artefact of the sample.
I run ablations on out-of-sample windows, never on the in-sample period. My general shape is a 2-year in-sample window, a 6-year walk-forward out-of-sample window, and an 8-year “old OOS” on data sitting before the in-sample period entirely. Ablating on the in-sample window measures how well the component fits the data it was chosen on, which is a number you already know the answer to. Ablate on the windows the component never saw.
One more thing: read the full outcome distribution before you judge. A component can leave net profit almost untouched while widening the tail of the drawdown distribution by half again. That is a component doing real work, and a Sharpe-only comparison will tell you to bin it.
What does it mean when removing a component improves the strategy?
It means the component was blocking trades that were, on net, profitable. This is the most valuable result ablation produces and the one that changes what ships.
News filters are the classic case. The instinct behind a news filter is sound: scheduled releases produce slippage, spread widening and violent two-way moves, so stand aside. But for a breakout strategy on FX majors or gold, scheduled releases are frequently where the edge lives. The move you were built to catch is the move the filter is standing aside for. Per-session trade attribution will tell you which of those two worlds you are in.
The same pattern shows up with volatility ceilings that cap out exactly where the strategy’s best trades sit, and with session filters calibrated to a liquidity profile that shifted two years ago.
When an ablation improves the result, resist the urge to delete the component that same afternoon. Confirm it on the second out-of-sample window, then check whether the improvement is concentrated in a handful of trades. If three trades carry the whole gain, you have found a sample quirk. If the gain is spread across the trade population, you have found a filter that was costing you money.
Where ablation sits in the build order
Ablation belongs after the strategy compiles and clears basic validation, and before it earns any live capital.
My loop runs like this. A scheduled Claude Cowork task scans sources, does the due diligence, forms the hypothesis and drafts raw MQL5 against my own code library: 18 standard filter modules plus a Position Ticket Capture pattern and a set of audit-derived rules. That library is where the guardrails live, so slippage and spread protection, volatility gating, drawdown breakers, consecutive-loss limits and hard max-loss triggers all come baked into every candidate. A post-flight validator greps each drafted file and rejects anything missing a module or breaking a rule. I compile manually in MetaEditor.
Ablation runs inside that backtester stage, after the first clean out-of-sample pass and before anything reaches the paper-trading gate. Nothing touches the live book without at least three months on paper, however good the file looks.
Doing it in that order matters. Ablating a strategy you have already optimised heavily tells you which components the optimiser leaned on, which is a different and less useful answer than which components carry the idea.
What ablation testing will not tell you
It will not tell you a component is safe to remove for a regime your sample never contained. A volatility breaker that never fires across ten years of data looks like dead weight right up until a 2015-style SNB morning or a March 2020 week. Insurance that has not paid out is still insurance. Judge tail-risk components on their design logic.
It will not separate two components doing the same job. Say your ADX filter and your volatility filter are gating roughly the same market conditions. Take either one out on its own and the other covers the gap, so both read as dead weight. Take both out and the strategy falls over. The fix is pairwise ablation on any components you suspect of overlapping. More runs, same thinking.
And it will not tell you the entry logic is any good. Ablation ranks components against each other inside the strategy you already have. A well-ablated strategy built on a weak entry is a clean, well-understood weak strategy.
Common questions
Does ablation testing work on machine-learning strategies?
Yes, and it is where the technique originated. For a feature-based model the unit of ablation is the feature: drop or randomise one input, retrain on the same window, and compare. The retraining step is the difference, because a model will often rebuild the lost signal from correlated inputs, which is itself the answer you were looking for.
How many components should a retail systematic strategy have?
There is no correct number, but every component should survive an ablation test on out-of-sample data. If a strategy carries six filters and four of them ablate to nothing, the honest description of what you own is a two-filter strategy plus four extra chances to have fitted the history.
Can I ablate the entry logic itself?
You can, and the standard version is to replace the entry with a random entry firing at the same frequency. If the strategy holds up, the edge is in the exit or the sizing. It is the same idea as benchmarking your exit against a random exit of matched average hold time, run from the other end.
Do I need to re-optimise after removing a component?
No, and re-optimising defeats the purpose. The point of the run is to isolate the contribution of one component with everything else frozen. Re-optimise once, after you have finished the full ablation sweep and decided what the final component set is, and treat that as a fresh strategy needing its own out-of-sample validation.
Start with the last filter you added
Take the strategy you are most confident in and find the component you bolted on most recently. It is usually the one added to fix something specific you saw in a chart, which makes it the most likely to be fitted and the least likely to have ever been tested on its own terms. Hold its gate open, re-run the out-of-sample window, and look at the number.
Half the time the number moves less than you expected.
I work for Darwinex (FCA-regulated). This is my personal commentary and not advice. Capital at risk.
Disclosure. I work for Darwinex (FCA-regulated). This is my personal commentary, not advice. Capital at risk. I am an employee of Darwinex; content touching Darwinex products may represent a conflict of interest, disclosed per MAR Article 20.
Past performance is not indicative of future results.
Get the next letter in your inbox.
The systematic trading handbook lands in your welcome email, all 24 chapters of it.
Subscribe now