Assume It’s Broken
No losing months. No losing years. Months of missing data. Don’t believe everything online.
- The published report had months of trading days simply missing. The strategy is supposed to trade a fixed set of weekdays every week without exception, and there are stretches where those days are absent from the record entirely.
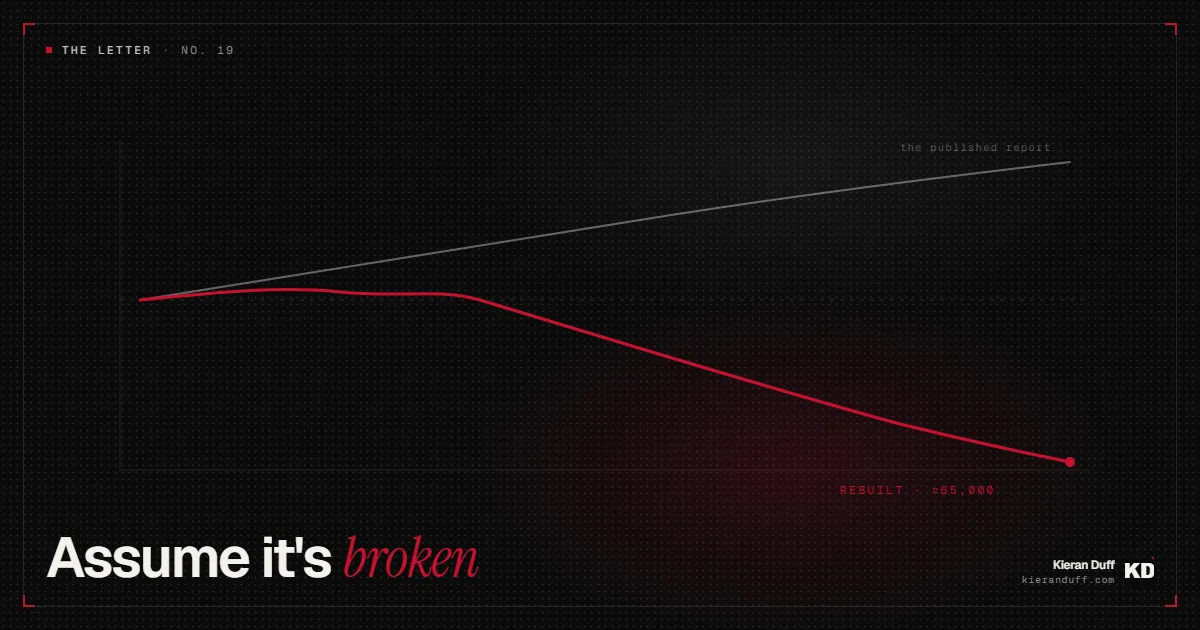
- I rebuilt it as close to their spec as I could work out, with every scheduled day in the sample. It goes from 100,000 to roughly 65,000. There’s no edge in it.
- I don’t think anyone was lying. Their EA clearly has a bug, the tester reported what the code did, and the report went up. That’s what should worry you, because it means someone with good intentions can publish a fraudulent-looking curve without ever knowing.
Someone sent me a link last week. A newish “quant” website posting a backlog of strategies, a basic thesis behind each one, full reports that you can download, with a few of them for sale. One had no losing months. No losing years either. That is the sort of backtest that should make your eyes roll, so I spent a couple of hours rebuilding it to find out whether anything real sat underneath.
There wasn’t.
What the report showed
A clean upward equity curve across a multi-year sample. No losing months. No losing years. Reasonable-looking trade count, a plausible thesis written up, and the kind of presentation that says somebody took this seriously. I’m not naming them and I’m not naming the market. This isn’t a call-out.
The person behind it is almost certainly not running a scam, and I’ll come back to why I think that. But the shape of the curve was off. Too tidy. Anything that trades a fixed weekly schedule for years and never has a red month is either exploiting something enormous that has somehow gone unnoticed for years, or it’s not measuring what you think.
Why I bothered rebuilding it
Because the logic was simple. That’s the whole reason. The thesis was documented plainly enough that I could sit down and write the thing myself in a couple of hours.
You either reproduce the curve or you don’t, and if you don’t, the gap tells you something. There’s a second reason, less noble. I wanted to know if the underlying idea had legs.
Plenty of badly-implemented strategies sit on top of a real observation, and if the observation is sound then the implementation is just work.
Finding a broken build of a good idea would have been a decent afternoon. So before I wrote a line of code I pulled their report and went through it properly. Which is where it fell apart.
The bit that gave it away
Dates.
The strategy trades a fixed set of weekdays. Every week. The write-up is explicit about it. That’s the spec. So the report should show trades clustered on those days, every week, for the length of the sample, with gaps only for holidays. It doesn’t…
There are stretches of months where those days don’t appear at all. They aren’t in the record as losers. They aren’t there as breakeven days, or as days where the setup never formed. They just aren’t there.
And it isn’t one clean block you could explain away as a data outage: there are random individual dates missing right through the sample too, scattered, with no pattern I could see from the outside. Missing days in a backtest are invisible in every summary statistic on the page. Win rate doesn’t know about them. Profit factor doesn’t know about them. The equity curve just connects the trades that happened, so a period where the strategy sat out shows up as nothing noticeable.
Every losing day inside those windows never got the chance to lose. That’s how you get no losing months. You delete the days that would have made them red. I want to be careful here, because I can’t see their code. What I can see is a report that claims a fixed schedule and doesn’t contain that schedule. That’s enough to stop trusting the numbers, and that’s all I’m saying.
That’s how you get no losing months. You delete the days that would have made them red.
What the real version looks like
I rebuilt it as close to their spec as I could work out from the write-up and the supporting theses (documented from online publications). Every scheduled day in the sample. And fills I’d actually expect to get out of a real broker. Starting balance 100,000.
It drifts sideways for the first stretch, pokes its head above 102,000 at one point, and then it bleeds. Steadily, month after month, no drama, no single catastrophic day, just a slow grind down to somewhere around 65,000. A third of the account, gone, on the same logic that produced a report with no losing years in it.
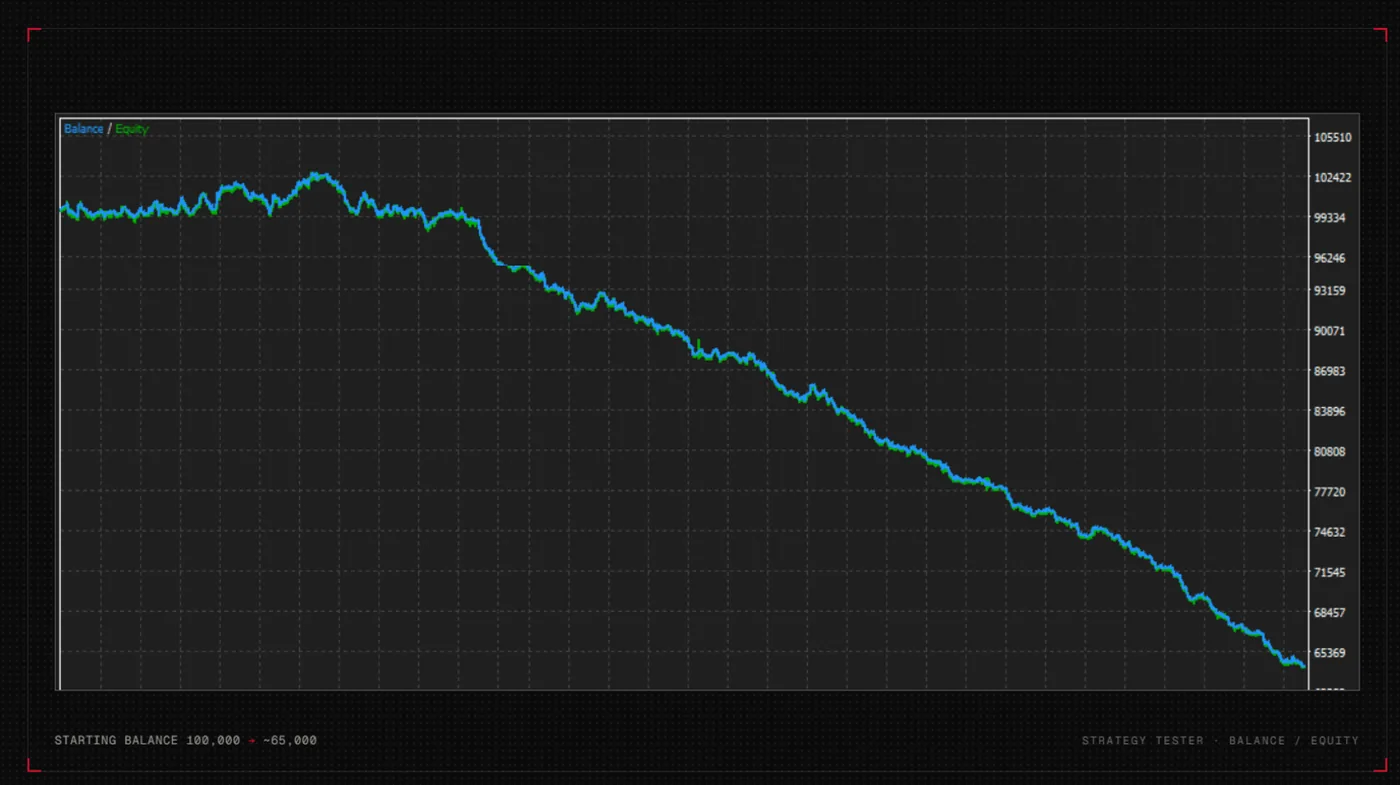
I’m not claiming my rebuild is their code. It won’t be, exactly. But the direction of travel is not subtle, and no reasonable difference in implementation turns that curve into theirs. The performance in that report was the missing data.
The performance in that report was the missing data.
So what actually broke?
This is the part to read if you write your own code, because the bug class is common and it is easy to miss. Please remember, this is just my best guess and I could be wrong, but my experience tells me that the bug is time handling, and the most likely culprit is daylight saving.
Here’s why that fits. An expert advisor running in MetaTrader reads the broker’s server time. Your own clock is irrelevant to it. Most brokers run their servers on something like GMT+2 or GMT+3, and a lot of them shift that offset twice a year to track US daylight saving. Some track European DST instead. Some don’t shift at all. There is no standard here. The offset belongs to the broker, and MQL has no say about it.
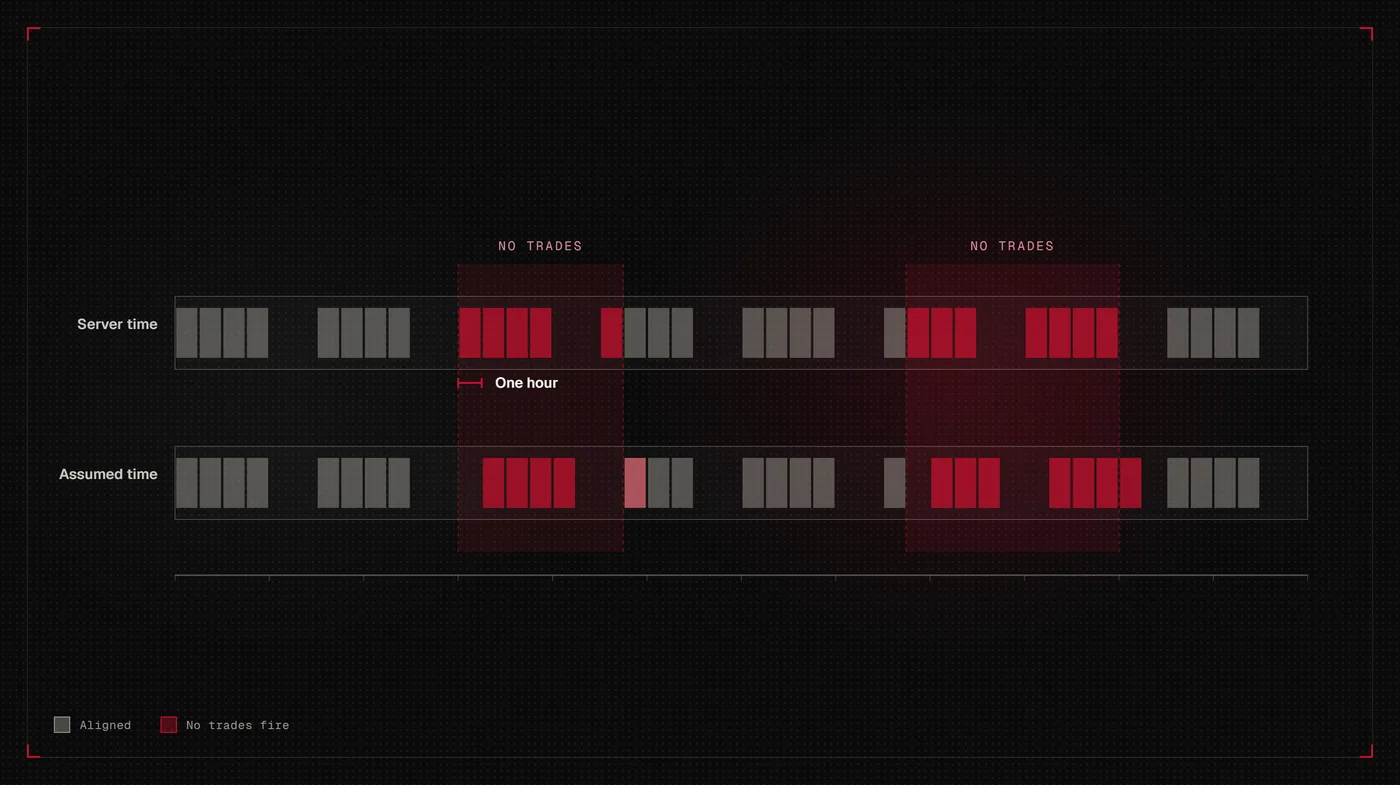
Now write a day-of-week filter. You call: DayOfWeek(), you check it against the days you want, and you combine it with an hour window because you only want to trade a particular session. That works fine. Until the server offset moves by an hour and your session window lands somewhere the setup doesn’t form, or your day boundary rolls over so that what the server calls Monday isn’t the Monday you meant.
Twice a year, for a few weeks at a time, the strategy goes quiet. It goes unnoticed, because there is nothing for the tester to register. You asked it to trade under a condition and the condition wasn’t met, so it didn’t trade, and it adhered to your rules. Mixing: TimeCurrent(), TimeLocal() and TimeGMT() inside the same EA does the same thing in a different way. So does a symbol that changed its name or suffix partway through the history, leaving a blank stretch in the data that the tester walks straight past. So does a broker whose M1 history has genuine holes in it, which is more common than you’d hope once you go back far enough.
Every one of those failure modes produces the same artefact: silence in the report, where losses should have been. And a strategy tester will never, ever tell you. It reports what happened. Nothing happening is a perfectly valid thing to report.
Why I think this was an accident
Because it’s too obvious.
If you were fabricating a track record you’d fabricate one that survives a glance. You’d put in some losing months, because a curve with no down months is the single most suspicious thing you can publish.
You’d fill the calendar, because gaps are the first thing a competent buyer checks. The version I found does neither, which reads far more like someone who ran a test, got a beautiful result, and had no reason to interrogate it.
A curve that only goes up generally doesn’t invite an audit from its creator (especially if they have any form of creator-bias). I’ve done a version of this to myself, and if you’ve been building for any length of time you probably have too. You write something, it produces an absurd result, and there’s a moment where you have to choose between believing it and going to look for the bug. The bug is quite often there, sometimes obvious, sometimes not so much.
How to audit a report before you trust it
None of this takes long. It’s tedious work and it isn’t hard, and it’s the highest-value twenty minutes you’ll spend on anything you’re being sold. Start with the calendar. Take the sample start and end dates, work out how many days the strategy should have traded given its stated schedule, and compare that to the number of distinct trade dates in the report. If those two numbers disagree by more than holidays can explain, stop reading the rest of the page (use AI here, it can scan a thousand page report faster than you can).
Then sort the trades by date and look at the biggest gap between consecutive ones. Every strategy has quiet periods. Very few have a three-month one. Check that every month in the sample appears at all. Forget whether it made money. Does the month exist in the trade list? Count the red months. Zero is a red flag. A strategy with a genuine edge still loses regularly, and anyone who has run real money knows it, which is why a real report leads with the drawdown.
Look at the fills. Entries that land on exact session highs and lows, exits that catch the turn, prices that sit on round numbers more often than chance allows: all of that is a tester being generous, and none of it survives contact with a real liquidity provider. Ask what spread and commission assumption was used. And if the logic is simple enough to rebuild, rebuild it. It’s an afternoon. You’ll learn more in that afternoon than in a week of reading somebody else’s documentation.
That list is the outside version of the one I run on my own strategies before anything goes live, which is what the final check covers.
Common questions
How can a backtest have no losing months?
Usually because losing days are missing from the sample. The strategy didn’t dodge them; they were never tested. Gaps in the data, a broken time or day filter, or a symbol change partway through the history will each remove trading days without raising any warning, and a day that was never tested cannot lose.
Does the strategy tester warn you about missing data?
No. The tester reports what the code did under the conditions it was given. If a filter excluded a period, or the price history had a hole in it, the result is simply an absence of trades, and an absence of trades is a valid outcome as far as the software is concerned.
How does daylight saving break a backtest?
An EA reads broker server time, and broker offsets often shift by an hour twice a year to track US or European daylight saving. A day-of-week or session-hour filter written against a fixed offset can fall out of alignment when that happens, so the strategy stops taking trades for weeks at a time without any error being raised.
What’s the fastest check on a published report?
Count the days. Work out how many days the strategy should have traded across the sample given its stated schedule, then count the distinct dates that actually appear in the trade list. If those numbers disagree, nothing else on the page means anything.
The same bug is in your own work
This is the actual lesson, and it isn’t really about the person who published this. Whatever you’re looking at, whoever produced it, start from the assumption that it’s broken and make it prove otherwise.
Start from the assumption that it’s broken and make it prove otherwise.
That’s easy advice to take about a stranger selling you something. It’s much harder to apply to your own backtest, because your own backtest is the one you want to believe, and every check you run against it is a check that might take the result away from you. Run them anyway. The alternative is finding out with real money, and that version costs considerably more than an afternoon.
Don’t trust your backtest is this same argument pointed inwards. Try to kill it is what the work looks like when you take it seriously.
Personal commentary, not advice. Capital at risk.
Disclosure. I work for Darwinex (FCA-regulated). This is my personal commentary, not advice. Capital at risk. I am an employee of Darwinex; content touching Darwinex products may represent a conflict of interest, disclosed per MAR Article 20.
XAQP figures are point-in-time as of August 2026 and will change.
Get the next letter in your inbox.
The systematic trading handbook lands in your welcome email, all 24 chapters of it.
Subscribe now