The Hidden Hero
MAE and MFE analysis reads your stops and targets from trades you have already closed. The distributions, the direction split, and the trap to avoid.
- MAE and MFE turn closed trades into a picture of where your stop and your target should sit.
- The distributions carry the information. A single trade’s excursion figures tell you nothing.
- Splitting the same data by trade direction is the fastest way to find out whether you have built a two-way system or a directional bet with extra steps.

I genuinely believe that your strategies MFE/MAE are the hidden hero that you aren’t aware that you even have. MAE/MFE analysis reads your stops and targets out of trades you have already closed. Maximum adverse excursion (MAE) is how far a trade went against you before it resolved. Maximum favourable excursion (MFE) is how far it went your way. Every backtest you have ever run produced both numbers for every trade and you’ve probably never analysed them as you should. Get them back and you can see, without touching a single line of entry logic, whether your exits are doing anything useful.
What are MAE and MFE?
Maximum adverse excursion is the furthest a position moved against you between entry and exit. Maximum favourable excursion is the furthest it moved in your favour over the same window. Both are measured on open trades and both are recorded regardless of how the trade finished. The metrics come from John Sweeney’s work in the mid-nineties, laid out in Campaign Trading, and they have been standard kit on futures desks ever since.
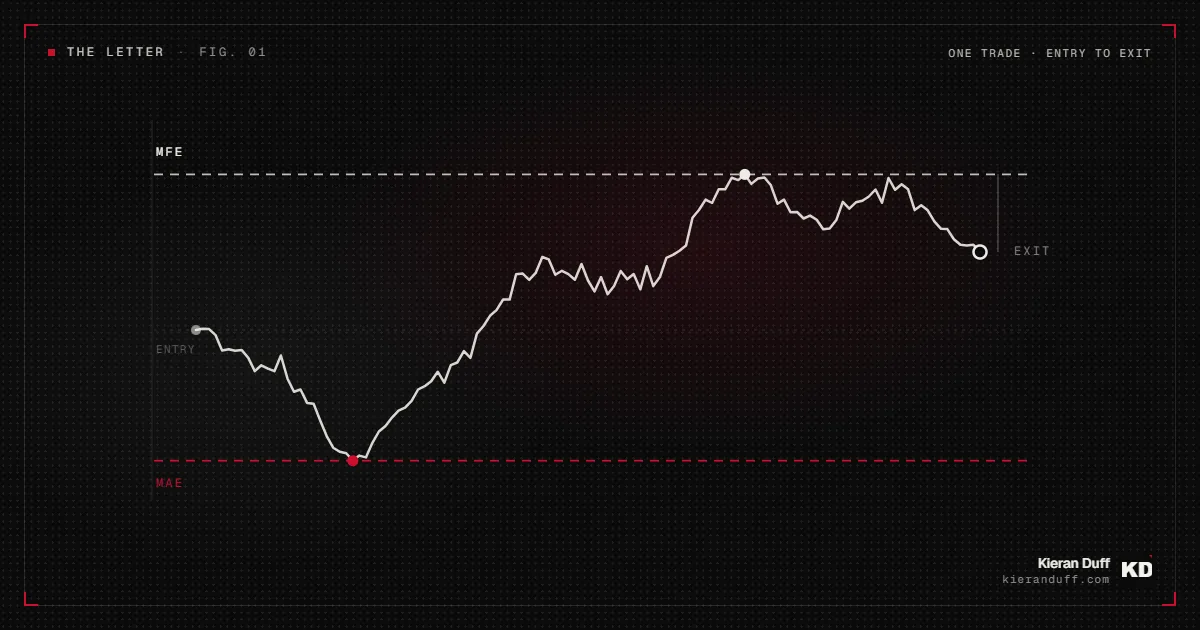
The useful part is that they are exit diagnostics generated by entry decisions you have already made. A winning trade that ran 40 pips against you before it turned gives you information about your stop. So has the loser that spent an hour 60 pips in profit and then came all the way back through your entry to a full stop-out, though what it is telling you about is the target. Neither observation requires you to change the entry, re-run an optimiser, or add a parameter.
For a systematic book this matters more than it does for a discretionary trader, because you have volume.
Twenty trades is an anecdote. Get into the hundreds and you have a distribution that is beginning to have any meaning.
Why does the MAE distribution beat your stop distance as a diagnostic?
Your stop distance is a number you chose. The MAE distribution is a record of what the market actually did to your positions, which is the thing your stop is supposed to be priced against.
Plot MAE for winning trades only. That single chart answers the stop question directly, because every one of those trades survived to become a winner while suffering that much “adverse movement”. If the winners cluster at MAE well under half your stop distance, the stop is sitting out in space. You are carrying risk on every trade that no winning trade has ever needed. Tighten it and you improve the R-multiple on the whole population without touching the win rate.
If losing trades show a fat cluster of MAE hitting the stop exactly, that is normal and expected. If losers show a wide spread of MAE well short of the stop, your exit logic is closing positions before the stop matters, and the stop is kinda pointless.
One discipline before you act on any of this: the MAE distribution of winners is a survivor population by construction. It only contains trades that made it.
What does the MFE distribution say about your targets?
It says how much of the available move you are capturing, which is a different question from whether you are profitable.
Take your winners and compute MFE minus realised profit for each one. That gap is what you handed back. Plot the distribution. A tight distribution near zero means your exit is landing close to the top of the move and there is nothing to fix. A long right tail means a subset of trades ran a long way past your target before reversing, and a fixed target is capping the trades that were carrying the strategy.
Then flip to the losers.
Run the same gap analysis there. A loser with high MFE is a trade that was in profit, sometimes substantially, and gave it all back plus the stop. If your losing population has a fat MFE tail, you have an exit that never banks any profit, and a trailing stop or a break-even rule will usually pay its way immediately. If your losing population has near-zero MFE, the trades went straight against you from entry and the exit is blameless.
What happens when you split the equity curve by direction?
Run longs and shorts as two separate equity curves on the same backtest output. Compare expectancy, win rate, average R, and the excursion distributions on each side. In a strategy that genuinely trades a two-way structural effect, the two curves look like siblings: different, obviously, but recognisably the same shape and both contributing.
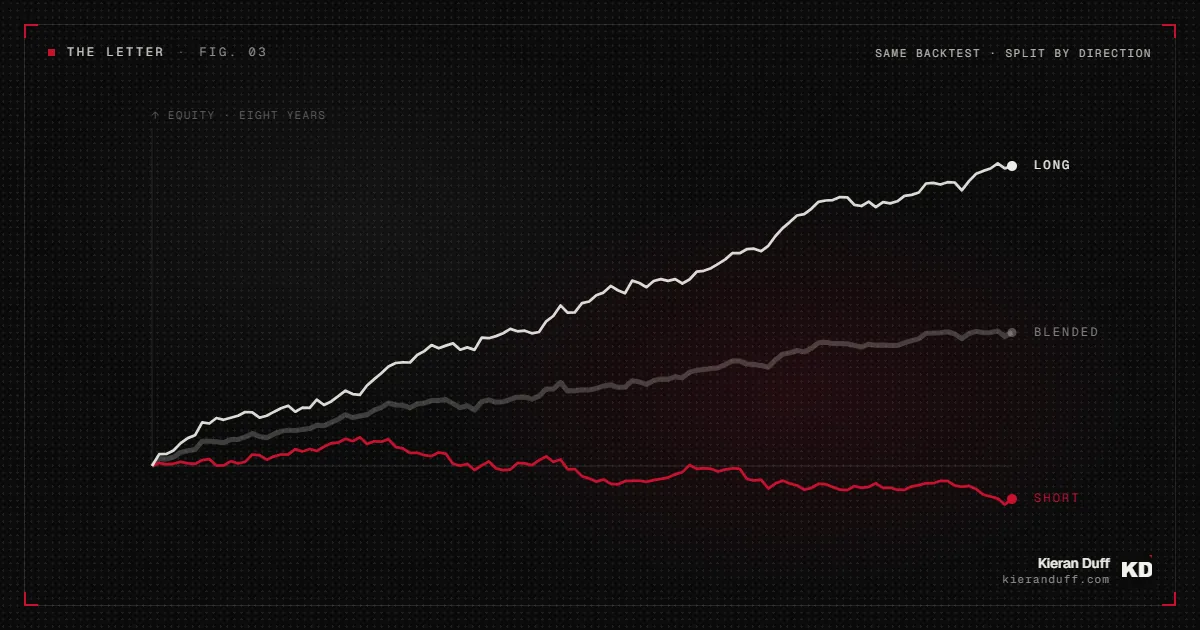
When one side is flat or negative across a long out-of-sample window, you have a directional bet with a short leg attached that is paying costs and adding variance. The blended curve hides this completely, which is why it survives review. A gold breakout strategy that only earns on the long side over eight years is a long-gold position with extra steps, and it will behave like one the first time gold spends a year going nowhere.
Shorts on index CFDs carry different overnight financing, frequently different spread behaviour, and a different volatility signature, so an MAE threshold that sits comfortably outside the mean when you are long can be buried inside it when you are short. Identical logic, and the correct stop distance is a different number on each side.
What you do about it is a judgement call. Sometimes the fix is separate exit parameters per direction. Sometimes it is deleting the dead side and accepting you own a one-way strategy, which is a perfectly respectable thing to own as long as you size the portfolio knowing it.
The trap: fitting your exits to the excursion chart
Excursion analysis produces suggestive charts, and suggestive charts are how a careful build gets overfitted anyway.
The mechanism is straightforward. You read the MAE plot, move the stop to the level the plot implies, re-run, and the backtest improves. Of course it does. You chose that level after seeing the data it is measured on. That is one more trial in a search you are already deep into, and Bailey and López de Prado’s work on the deflated Sharpe ratio is precisely about how much performance inflation a run of undeclared trials produces (SSRN).
Three rules keep this realistic.
- Derive the exit change on one window and confirm it on another the change has never seen. If the MAE plot on your 2-year in-sample window says move the stop and the plot on the 8-year window sitting before it disagrees, you found a sample quirk.
- Reach for structural changes first. “Add a time stop at 40 bars because the MFE on losers dies after 40 bars” is a structural claim you can test on any instrument. “Move the stop from 1.4 ATR to 1.15 ATR” is a knob you turned after seeing the answer.
- And treat any exit change as a new strategy. It goes back through the full validation, an ablation pass to check the change is carrying its own weight, and three months on paper before it earns live capital.
How do you turn excursion data into something you can test?
Start from the shape of the distribution and write the change as a rule, then test the rule the same way you would test any other component.
If winner MAE clusters far inside the stop, the testable change is a tighter stop expressed in the same units the strategy already uses, usually an ATR multiple. If loser MFE has a fat tail, the testable change is a break-even trigger or a trailing stop with a defined activation threshold. If the MFE gap on winners is wide and right-skewed, the testable change is removing the fixed target and replacing it with a trailing exit or a time-based one. If the direction split shows one dead side, the testable change is per-direction parameters or removal.
Then run each change on its own. One change, one re-run, one comparison against the strategy’s noise band from a bootstrap of the original trade sequence. Stacking three exit changes and reading the combined result is how you end up unable to say which one helped.
What excursion data will not tell you
It will not tell you your entry is any good. Excursion analysis takes your entries as given and reports what happened afterwards. A strategy with no edge in the entry will still produce clean, readable MAE and MFE distributions, and optimising its exits will produce a well-tuned strategy with no edge.
It will not survive a change in volatility regime without recalibration. Excursions scale with volatility, so a distribution built through a calm stretch will look wrong the first time the instrument doubles its ATR. Express thresholds in volatility-relative units and re-check the distributions when the regime shifts.
It also has nothing useful to say about correlation between your strategies, position-level risk, or whether the book can carry the thing at all. Those are portfolio questions and this is a trade-level tool.
Common questions
What is a good MAE for a winning trade?
There is no universal number, because the answer depends on your stop distance and your instrument’s volatility. The comparison worth making is relative: winner MAE as a percentage of stop distance, read as a distribution across a few hundred trades. That ratio is portable across strategies and instruments in a way that raw pips never is.
Can I use MAE to set my stop loss directly?
You can derive a candidate stop from it, and you should then treat that candidate as an untested hypothesis. The MAE distribution of winners is a survivor population, so a stop fitted to it will look better in the backtest than it performs live. Confirm it on a window it was never derived from before you let it near the live book.
Does MAE and MFE analysis work for algorithmic strategies?
It works better for algorithmic strategies than for discretionary ones, because the trade population is large, the entry rule is fixed, and the excursion data is already sitting in your backtest output. QuantAnalyzer will read an MT5 report and produce the plots directly.
Should I look at MAE and MFE on live trades or backtest trades?
Both, and the gap between them is its own diagnostic. If live MAE runs consistently wider than backtest MAE on the same strategy, your slippage or spread assumptions are optimistic and the excursion drift is measuring the cost of that error.
Run it on your worst strategy first
Take whichever live strategy is annoying you most, pull the closed trades, and plot four things: winner MAE, loser MAE, the MFE gap on winners, and the long and short curves side by side. None of it requires you to touch the entry logic.
Usually one of those four charts is obviously wrong, and it is rarely the one you expected.
I work for Darwinex (FCA-regulated). This is my personal commentary and not advice. Capital at risk.
Disclosure. I work for Darwinex (FCA-regulated). This is my personal commentary, not advice. Capital at risk. I am an employee of Darwinex; content touching Darwinex products may represent a conflict of interest, disclosed per MAR Article 20.
Past performance is not indicative of future results.
Get the next letter in your inbox.
The systematic trading handbook lands in your welcome email, all 24 chapters of it.
Subscribe now